Spatial Computing - Lucia Rebolino - Unpredictable Atmosphere

Unpredictable Atmosphere

Lucia Rebolino

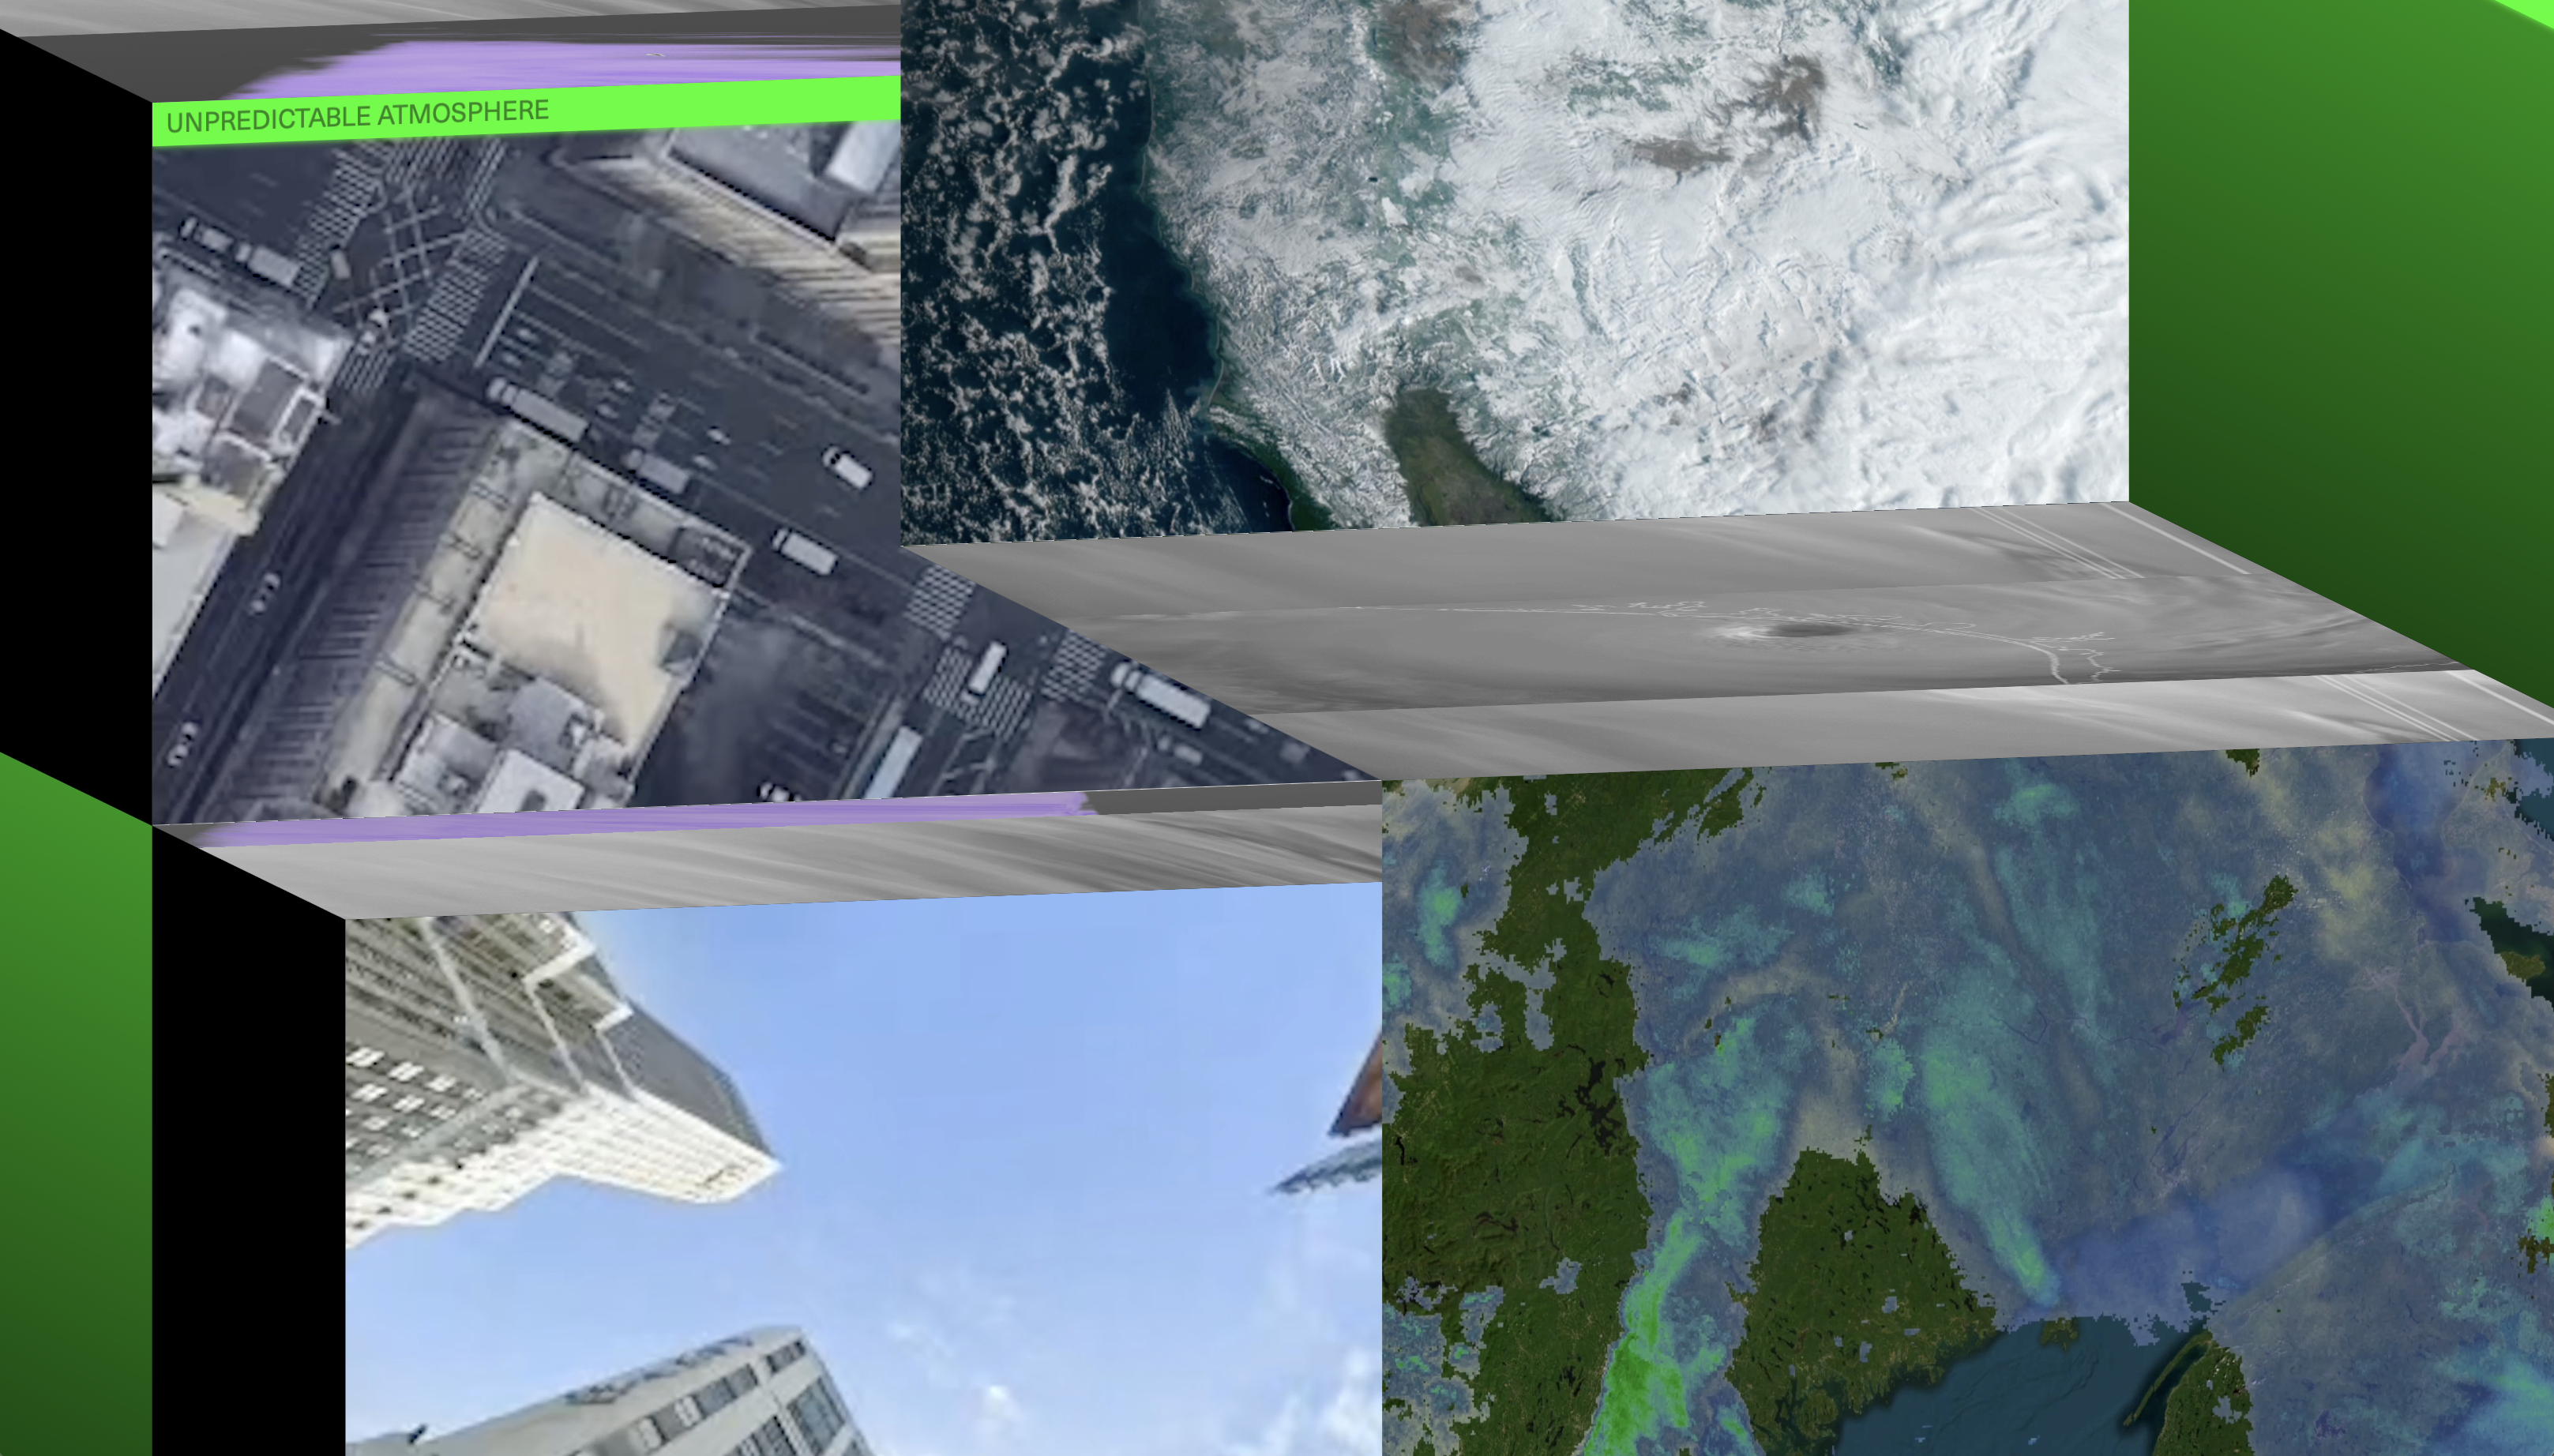
Interface that envisions the web as a physical space, and uses “quadrants” as a metaphor to represent the tools, scales, and perspectives used to shape and understand the world around us. It slices the atmosphere into components, allowing exploration and understanding of the complex interactions between various weather data sets and technological infrastructure.

Spatial Computing
June 2024

On August 23, 2017, a hurricane warning was released by the US National Weather Service, and a state of emergency was declared for thirty counties. Hurricane Harvey intensified unexpectedly quickly as it approached coastal Texas, eventually claiming sixty-eight lives, causing widespread displacement, and leading to immeasurable environmental and infrastructural damage.1 During hurricane season, which runs from June through November, roughly half a dozen storms develop in the Atlantic basin without ever making landfall.2

These storms, along with those threatening landfall, are closely monitored using climate models that assess their paths and potential intensity. This process consists of a blend of certainty—provided by sophisticated mathematical models and existing technologies—and uncertainty—which is inherent in the dynamic nature of atmospheric systems. This is perhaps best represented by the forecast cone, a graphic tool in weather prediction designed to communicate what and who is in a storm’s path, and, as a consequence, how quickly communities must act. The boundaries of the cone are designed to include the area within which the storm’s path is predicted to go. The cone widens as forecasters look further ahead, indicating more uncertainty in the expected path of the storm.

So much depends on our ability to forecast the weather—and, when catastrophe strikes, on our ability to respond quickly. An architecture of forecasting is crucial for providing accurate and timely weather information and collecting essential weather and climate data. Meteorological research organizations gather weather data by measuring the vibration of water vapor particles in the atmosphere. While visible or infrared satellite imagery aids in weather forecasts, it is microwaves, specifically in the range of 20 to 200 GHz on the electromagnetic spectrum, that provide the most critical information for meteorological analysis. Polar-orbiting satellites, equipped with highly sensitive sensors, like microwave sounders, detect these vibrations, and are optimized for the 23.8–24 GHz frequency bands, due to the natural resonance of water vapor at these frequencies.

The uncertainties shaping weather forecasting interference are visualized on the other side of the interface as layers, allowing exploration of unseen concepts and elements in climate modeling, such as the real-time positions of weather satellites, the movement of water vapor over time, and the finite structure of the spectrum as a matrix space.

Monitoring water vapor and understanding the moisture in the atmosphere is crucial for warning about and understanding hurricanes and cyclones, as the moisture context around the storm influences the eventual rainfall and flooding it generates. But in the era of climate change, weather patterns can shift unpredictably. Harvey’s path fell within the cone of uncertainty, and suddenly spun into a record-breaking disaster. With the refinement of forecast technologies, the accuracy of numerical and spatial calculations to predict catastrophic events has improved in the years since Harvey. However, the rise in both the frequency and impact of weather- and climate-related billion-dollar disasters in the United States can be attributed shifting environmental patterns that lead to increasingly unpredictable weather scenarios.3

The electromagnetic spectrum, which lends itself to a wide range of applications, from radio broadcasting to satellite observation, is a finite space and must be carefully managed to accommodate diverse uses. International and national regulatory bodies have long allocated specific portions of the spectrum for passive weather observation in order to prevent interference and maintain the precision of meteorological data.4 Water vapor frequency, however, exists inside the “greenfield,” or open bands on the spectrum (around 24 GHz and above) where technologies can be implemented without being constrained by pre-existing uses, which is meant to enable more efficient and innovative uses of the spectrum.

The 24 GHz band falls within the millimeter wave spectrum, which allows for high-speed data transmission. It has therefore recently attracted the attention of telecommunications companies who are building wireless communications networks. These companies have begun utilizing this spectrum band for new “high-band” 5G networks, which disrupt the collection of atmospheric data. The critical proximity between weather observation and telecommunications technologies on the electromagnetic spectrum has resulted in political conflicts over the use of these open bands, and created a space of uncertainty about the limits of our ability to predict future climate.5

00:00
00:00

Climate models often incorporate three-dimensional structures to simulate and analyze the complex interactions within Earth’s atmosphere. In a 3D climate model, space is divided into a grid system, and, within each grid cell, the model simulates the physical processes and interactions that occur around Earth and its atmosphere.

Climatic Media

Water vapor is a ubiquitous and dynamic component of Earth’s atmosphere, constantly changing in response to the intricate and complex interplay of physical and chemical processes. It is an invisible, gaseous form of water that can exist in varying concentrations and distributions, driven by local and global weather patterns, as well as by human influence. Atmospheric water vapor is a key variable in determining the formation of clouds, precipitation, and atmospheric instability, among many other things.6

Microwave emissions from molecules such as oxygen and water vapor are used by meteorologists to identify and analyze weather systems, and to develop a vertical profile of temperature and humidity. The ability of microwaves to penetrate through clouds without being absorbed makes them an especially useful tool for analyzing clouds’ internal structure, and then for predicting the future development of storms and severe weather events. For years, only a handful of weather professionals and scientists, primarily from the National Oceanic and Atmospheric Administration (NOAA) and the National Aeronautics and Space Administration (NASA), had any interest in water vapor’s portion of the electromagnetic spectrum. But now that has changed.

5G technology promises faster network speeds, more users, and a future where every device can be connected to a network known as the “Internet of Things.” The wireless industry quickly agreed to 5G standards and started building out infrastructure, requiring more spectrum real estate to support the growing demand. This led to a campaign by the Federal Communications Commission (FCC) to open the greenfield and sell bands of frequencies between 24–25 GHz to companies invested in 5G technology.

00:00
00:00

The interface’s quadrants display videos tracing the path connecting 5G towers emitting at 24 GHz across various US cities. The path, observed from both above and below through satellite data in both the visible and invisible spectrum and across different scales, serves as a metaphor for comprehending the visual and spatial dimensions of the vast data that make up the complex infrastructure of weather forecasting. The quadrants interface folds into a geometrical structure, revealing the inverse process of building a prediction system—from the root of visible imagery to the insights of the data that structure the process of unseen interference.

Terrestrial radio systems emitting 5G signals into this defined spectrum range, so close to the bands allocated for weather sensing (23.8–24 GHz), are a formidable threat to weather forecast and warning services. This is due to the much louder nature of 5G waves compared to those emitted by the atmosphere, and the relatively quiet movements of water vapor molecules that satellites observe. According to federal agencies and meteorologists worldwide, if the 5G signal remains contained between 24–25 GHz, it can coexist alongside existing meteorological operations. However, if it becomes louder, it will bleed over into the weather sensing space, drowning out any noise—invaluable for climate models—emitted by water particles.

The allocation of the electromagnetic spectrum involves assigning specific frequency bands to different uses and regulating their usage to avoid interference. The decisions and negotiations regarding spectrum allocation are typically made by government agencies, such as the Federal Communications Commission (FCC) in the United States. The finite nature of spectrum space is determined by the bandwidth and propagation characteristics of each frequency band, and acquiring spectrum rights often involves substantial financial investments through auctions or licensing agreements.7 Spectrum allocation impacts a wide range of stakeholders, including industries relying on wireless communication, technological innovation, national security, and individual consumers who use wireless services.

Despite explicit concerns from NOAA, NASA, meteorological authorities, oversight committees, and the scientific community about the potential impact on weather forecasting, the FCC proceeded with the auction of the 24 GHz band in 2019.8 The FCC’s auction of the 24–25 GHz spectrum band resulted in revenue of $2 billion for the Department of the Treasury. However, the potential costs resulting from unpredicted, severe weather events could far outweigh this.9 Later that year, the House Science Committee requested an investigation by the Government Accountability Office into the conflicting arguments presented about the potential Radio Frequency Interference (RFI) of 5G on weather forecasting. The committee has increasingly emphasized the importance of resolving these issues based on scientific evidence rather than political motivation.10

00:00
00:00

The two sides that replace the quadrant view are related to the visual and spatial investigation of spectrum allocation. To grasp the complexity of this finite yet undetermined space, the matrix only shows the value that the FCC has given to mobile networks and the space that is dedicated to mapping the earth system in a passive way.

Sensing Models

Nearly 99% of weather observation data that supercomputers receive today come from satellites, with about 90% of these observations being assimilated into computer weather models using complex algorithms. These algorithms, known as numerical weather prediction models, convert observational data into a numerical representation of the atmosphere in time to make weather predictions.11 NOAA and NASA have concluded that the out-of-band emissions limits set by the FCC—which control how much radiofrequency energy devices can emit outside their allocated frequencies—are insufficient to prevent interference with weather satellites’ ability to detect water vapor.

In 2023 NOAA issued a call for proposals aimed at researching and developing microwave weather sensors, ground systems, and technologies that could help reduce interference caused by 5G networks.12 This initiative is part of NOAA’s broader strategy to update its weather and climate-monitoring constellations, ensuring that the accuracy and reliability of weather data are not compromised by the introduction of new telecommunications services. Alongside this, the National Science Foundation-funded SWIFT project at Rutgers University addresses the challenges of 5G interference on weather predictions. This project is dedicated to developing “algorithm designs, reference architectures, and testbed experiments that will provide pointers to engineering methodology for the design of spectrally and system power-efficient 5G/B5G networks that can peacefully coexist with passive weather sensors.”13

To accurately predict weather patterns in the future, it will be essential to understand and map the space of interference that exists between 5G telecommunications infrastructures and weather observation systems.14 Weather satellites collect data and measure the energy radiated from Earth at the water vapor frequency to assess the moisture content in the atmosphere. There are two types of satellites involved in weather monitoring: Geostationary Operational Environmental Satellites (GOES) and Joint Polar Satellite System (JPSS). GOES satellites are used for weather monitoring, including capturing satellite imagery of Earth’s surface. JPSS satellites are used to scan the atmosphere vertically, and are equipped with passive sensors that “listen” to the water vapor—instead of emitting a pulse like a radar—and are specifically designed to sense at 23.8 GHz, among other frequencies.

A 5G station transmitting at nearly the same frequency as water vapor can be mistaken for actual moisture, leading to confusion and the misinterpretation of weather patterns. This interference is particularly concerning in high-band 5G frequencies, where signals closely overlap with those used for water vapor detection. High-band 5G operates at much higher frequencies, typically in the millimeter-wave range (24GHz to 40GHz), allowing for faster data speeds but also presenting challenges in signal propagation. These high frequencies are absorbed more readily by atmospheric gases, including water vapor, resulting in significant signal attenuation. Consequently, the potential for interference with weather sensing is heightened in high-band 5G due to the proximity of its frequencies to those critical for water vapor detection.

Low-band 5G operates at lower frequencies, typically below 1 GHz, which have longer wavelengths and better propagation characteristics, but are slower. Despite the fact that these lower frequencies are less likely to coincide with critical atmospheric frequencies—and thus pose a lower risk to weather sensing satellites and less potential for interference—telecommunications operators and policymakers prefer to meet the growing demand for high-speed connectivity by deploying high-band 5G networks.

00:00
00:00

The final moment of the interface is represented in the totalizing visualization of the entities shaping the atmosphere. Water vapor is projected onto a sphere, surrounded by those satellites that fail to detect and capture it. The satellite’s vantage point should be one that perceives the space from above, but the visualization aims to underline the limitations of technology by showing how satellites, even if they are able to see at a larger scale and vantage perspective, have limitations when mapping the atmosphere in all its shapes.

Radio Frequency Interference (RFI) describes how electromagnetic signals from one source can disrupt signals from another in the same frequency range. Placed in orbit, RFI detectors assess radiometric noise over Earth. Scientists have observed RFI in weather data from 5G transmitters as a function of 5G station density, which necessitates the identification and removal of tainted data.15 The variability in contamination “signatures” may lead to larger “stay out” zones and the exclusion of more data to safeguard against potential contamination. The emergence of RFI from 5G infrastructure in weather data highlights the complexities inherent in modern environmental monitoring, and underscores the urgency of innovative approaches in climate science.

Climate models recreate past climates to predict future ones, and rapid technological progress and the ability to predict atmospheric patterns have transformed the way we understand natural processes. Today, there’s a need for a socio-technical system that collects data, models physical processes, tests theories, and generates a shared understanding of climate and climate change, effectively bridging the gap between science and societal awareness.16 Towards these ends, NASA is currently making a long-term commitment to building an inclusive open science community over the next decade.17 Within this, they encourage software, data, models, and knowledge (algorithms, papers, documents, ancillary information) to be shared as early as possible in the scientific process.

Climate science derives mostly from models, but the complexity and uncertainty of the atmosphere’s climate system mean that these models must continually evolve. At the same time, we must reconsider how to approach uncertainty as a condition of possibility within the complexities of weather and climate modeling. The invisible space of conflict revealed by water vapor measurement is a domain where multiple perspectives and scales are necessary to understanding and comprehending the interactions between diverse systems and processes. From atmospheric water vapor, cloud cover, storm patterns, and moisture levels, to ground data from antennas and radar systems, crowd-sourced databases, open-source information, and APIs, there are many sources for revealing spatial correlations in diverse datasets. New aesthetics and languages of prediction can help modulate concrete aspects of climate into data and images that aid in remapping our concept of unpredictability.

Notes
1

Katy Mersmann, “Harvey Was TD-09—Atlantic Ocean,” NASA, September 13, 2017. See .

2

The average annual activity during the Atlantic hurricane season is characterized by approximately 14 named storms, with about half of these intensifying into hurricanes. Recent observations indicate that an average of 3 to 5 hurricanes make landfall in the United States each year, though this number exhibits variability based on specific annual weather patterns and oceanic conditions. National Hurricane Center and Central Pacific Hurricane Center, “U.S. Hurricane Strikes by Decade,” see .

3

In 2023, there were 28 confirmed weather/climate disaster events with losses exceeding $1 billion each to affect the United States. NOAA National Centers for Environmental Information (NCEI), “U.S. Billion-Dollar Weather and Climate Disasters” (2024), see .

4

The radio spectrum is the radio frequency (RF) portion of the electromagnetic spectrum. In the United States, regulatory responsibility for the radio spectrum is divided between the Federal Communications Commission (FCC) and the National Telecommunications and Information Administration (NTIA).

5

NOAA Administrator Neil Jacobs testified to Congress that the FCC auction has the potential to degrade meteorological forecasting ability by around 30%, and decrease the hurricane forecast lead time by 2 to 3 days. Sarah E. Benish et al., “Policy Memo: The Impact of Emerging 5G Technology on U.S. Weather Prediction​,” Journal of Science Policy & Governance 17, no. 2 (October 17, 2020).

6

The extent of water vapor and moisture level in the atmosphere indicates the shifts in sea surface conditions, land drought occurrences, behavior of polar ice caps, and positions of tropical cyclones. Without a clear understanding of water vapor patterns, it becomes difficult to isolate the potential sources or sinks for warming or cooling in the atmosphere.

7

In 1993, the FCC gained authority from Congress to auction radio frequency licenses, a pioneering strategy that not only achieved a Nobel Prize in 2020 for its innovation, but also contributed significantly to government finances, generating approximately $230 billion for the Treasury.

8

“Auction 102– 24 GHz,” FCC Public Reporting System, see .

9

“Auction 102: Spectrum Frontiers – 24 GHz,” Federal Communications Commission, see .

10

Jordan Gerth, “Testimony before the House Committee on Energy and Commerce,” July 20, 2021, see .

11

Paul N. Edwards, A Vast Machine: Computer Models, Climate Data, and the Politics of Global Warming (Cambridge, MA: MIT Press, 2010).

12

“Broad Agency Announcement: Ground Processing Demonstrations (GPD),” NOAA, April 13, 2023, see .

13

Narayan Mandayam et al., “SWIFT: Enabling Spectrum Coexistence of 5G mmWave and Passive Weather Sensing,” Rutgers University Wireless Information Network Laboratory, October 1, 2021, see .

14

Bruno Latour, Science in Action: How to Follow Scientists and Engineers Through Society (Cambridge, MA: Harvard University Press, 1987).

15

Jordan Gerth, “Scientific & Meteorological Use of Spectrum,” Presentation at the 2022 National Spectrum Management Association (NSMA) Conference 2022, University of Wisconsin & NOAA.

16

Edwards, A Vast Machine.

17

“Open Science at NASA,” NASA, see .

Spatial Computing is a collaboration with the M.S. in Computational Design Practices Program (MSCDP) at the Graduate School of Architecture, Planning, and Preservation (GSAPP) at Columbia University.

Category
Architecture, Technology, Data & Information
Subject
Infrastructure, Outer Space, Climate change
Return to Spatial Computing

Lucia Rebolino is an architect and a research-based computational designer. She is currently a Researcher at Forensic Architecture in London and a Teaching Associate of the MSc Computational Design Practices at Columbia University GSAPP in New York.

Advertisement
Subscribe

e-flux announcements are emailed press releases for art exhibitions from all over the world.

Agenda delivers news from galleries, art spaces, and publications, while Criticism publishes reviews of exhibitions and books.

Architecture announcements cover current architecture and design projects, symposia, exhibitions, and publications from all over the world.

Film announcements are newsletters about screenings, film festivals, and exhibitions of moving image.

Education announces academic employment opportunities, calls for applications, symposia, publications, exhibitions, and educational programs.

Sign up to receive information about events organized by e-flux at e-flux Screening Room, Bar Laika, or elsewhere.

I have read e-flux’s privacy policy and agree that e-flux may send me announcements to the email address entered above and that my data will be processed for this purpose in accordance with e-flux’s privacy policy*

Thank you for your interest in e-flux. Check your inbox to confirm your subscription.