Internet measurement can be understood as the act of collecting and analyzing data related to or demonstrative of how the internet is performing. Similar to how we measure changes in our environment, economy, and health, we measure the internet to see how it’s working and to check if any changes are having the intended effect. There are many ways to measure the internet, just as there are many ways to ask a friend how they feel. But no matter how we choose to do it, internet measurement—like all data-centric disciplines—inevitably bumps into questions: what are we trying to measure? What does it mean for the internet to be working the way we want it to? And who is we?
To generalize, the design of every internet measurement methodology includes decisions about where in the network to study and what aspects of behavior are being observed. For example, to measure the “speed” of a connection, a certain amount of data can be sent from Point A in the network to Point B, and the time elapsed to traverse between the two recorded. Simple in the abstract, but, in practice, more particular decisions are needed to implement the measurement. The internet, after all, is a stack full of idiosyncratic protocols heaped onto one another, so which of these protocols are we paying attention to? At the network layer? The application layer? The transport or routing layer? The easy answer is “the ones that matter,” but which ones matter depends on what kind of data is being transferred and why.
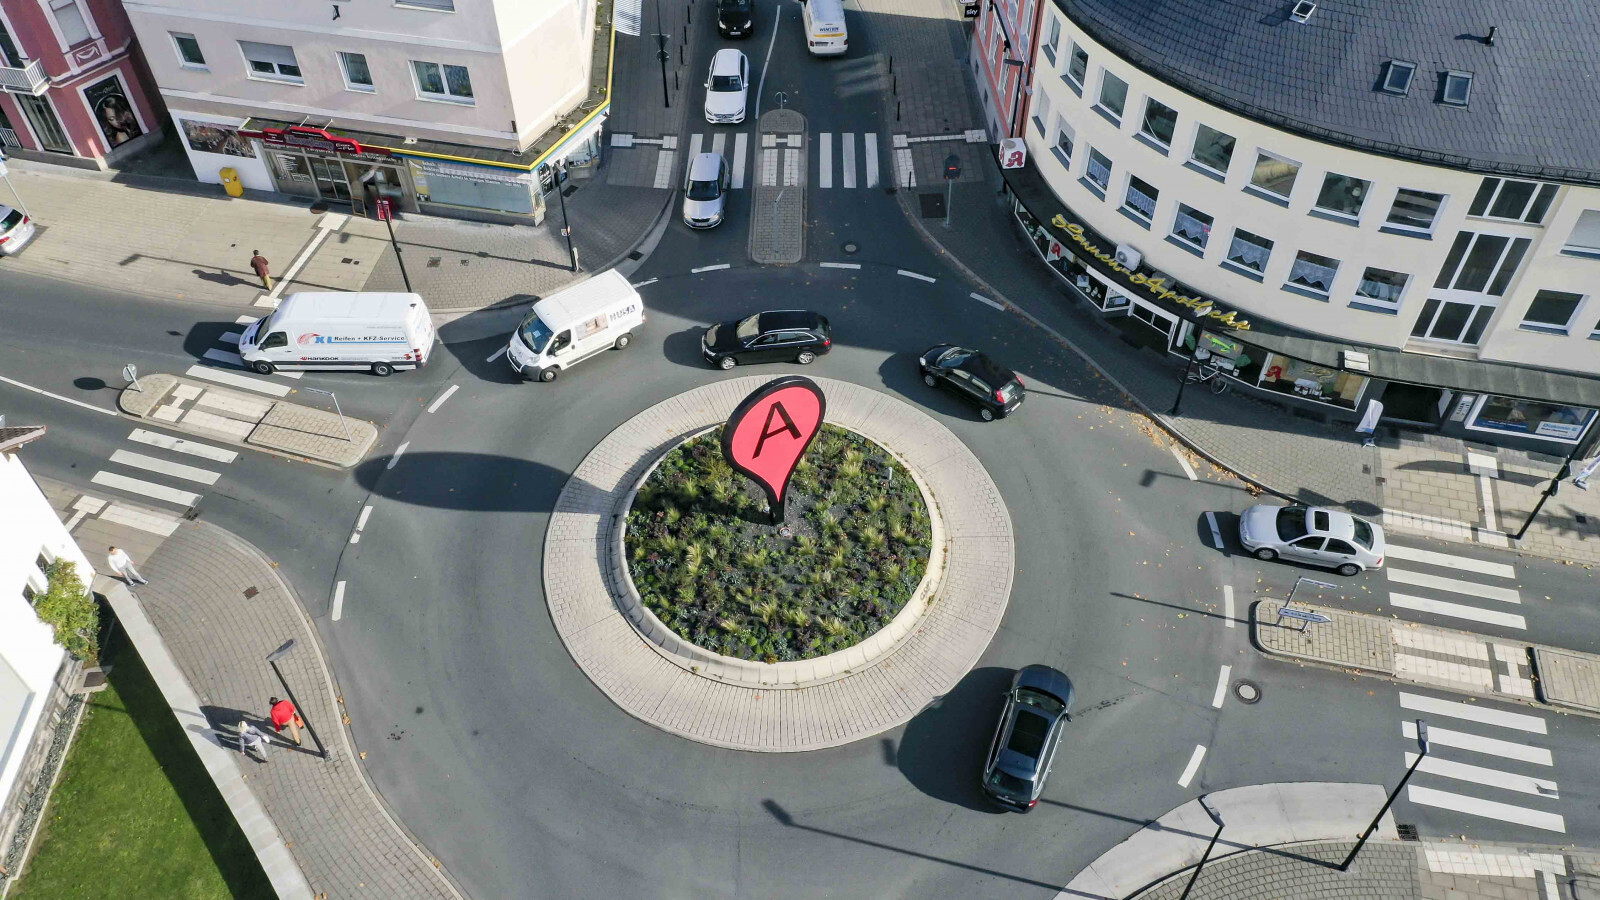
This quickly brings us back to the question of what we are trying to measure. Is the internet for browsing self-published websites? E-commerce? Messaging? Video streaming? Game playing? Social networks? While the intuitive answer might be all of the above, standardizing around a particular definition to accurately represent that reality has plagued internet researchers for decades, as has the location of the selected vantage points—where is Point A and Point B? Which parts of the network do we care about being well connected? Are the pathways between users and popular content providers such as Netflix, Google, and Facebook the ones that matter, or is it the pathways between these content providers and the rest of the internet that we should be paying attention to? And what about the rest of the internet? How well are we able to access content stored outside the limits of platform dominance? Though rarely phrased in such existential terms, policymakers implicitly consider such questions when defining what internet service providers (ISP) can and cannot do, and what their responsibilities are as public infrastructure.
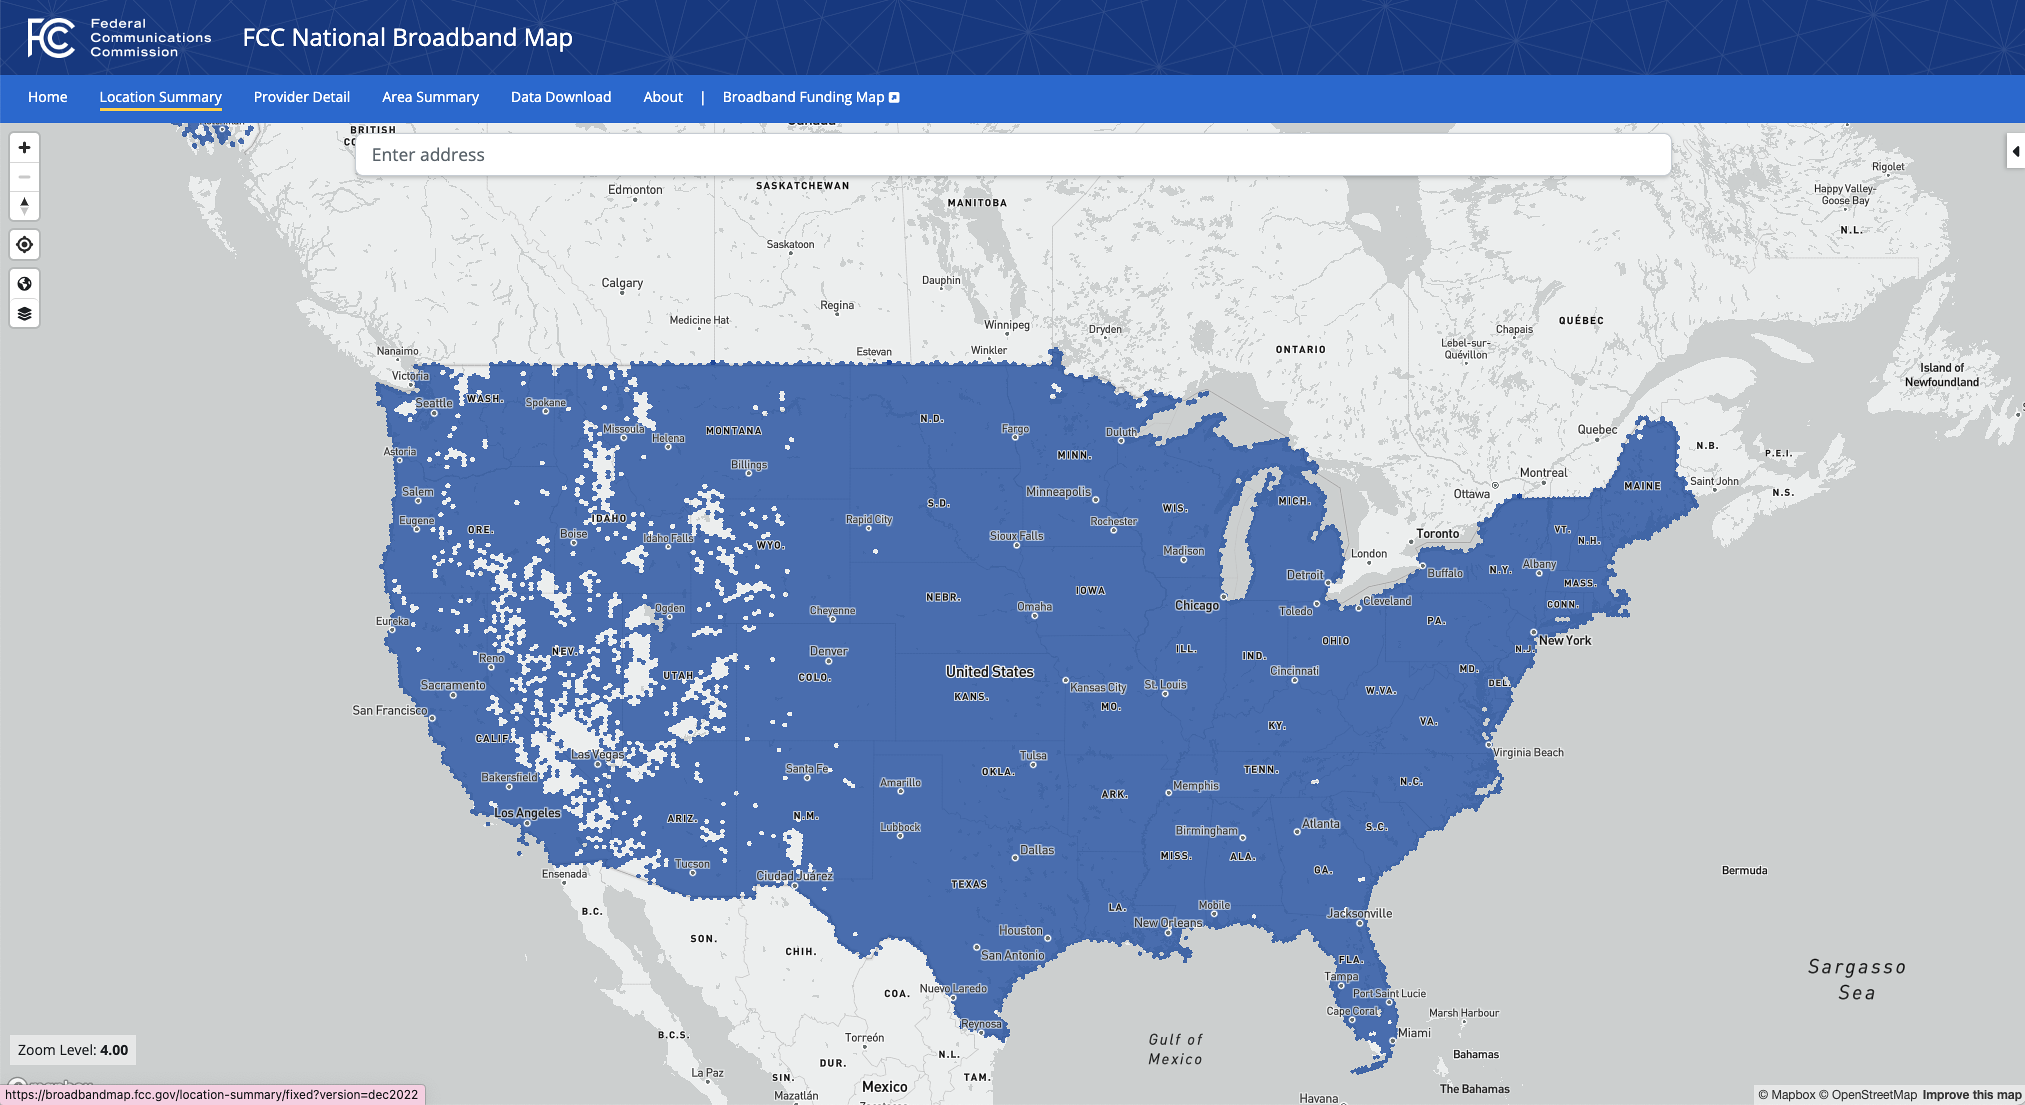
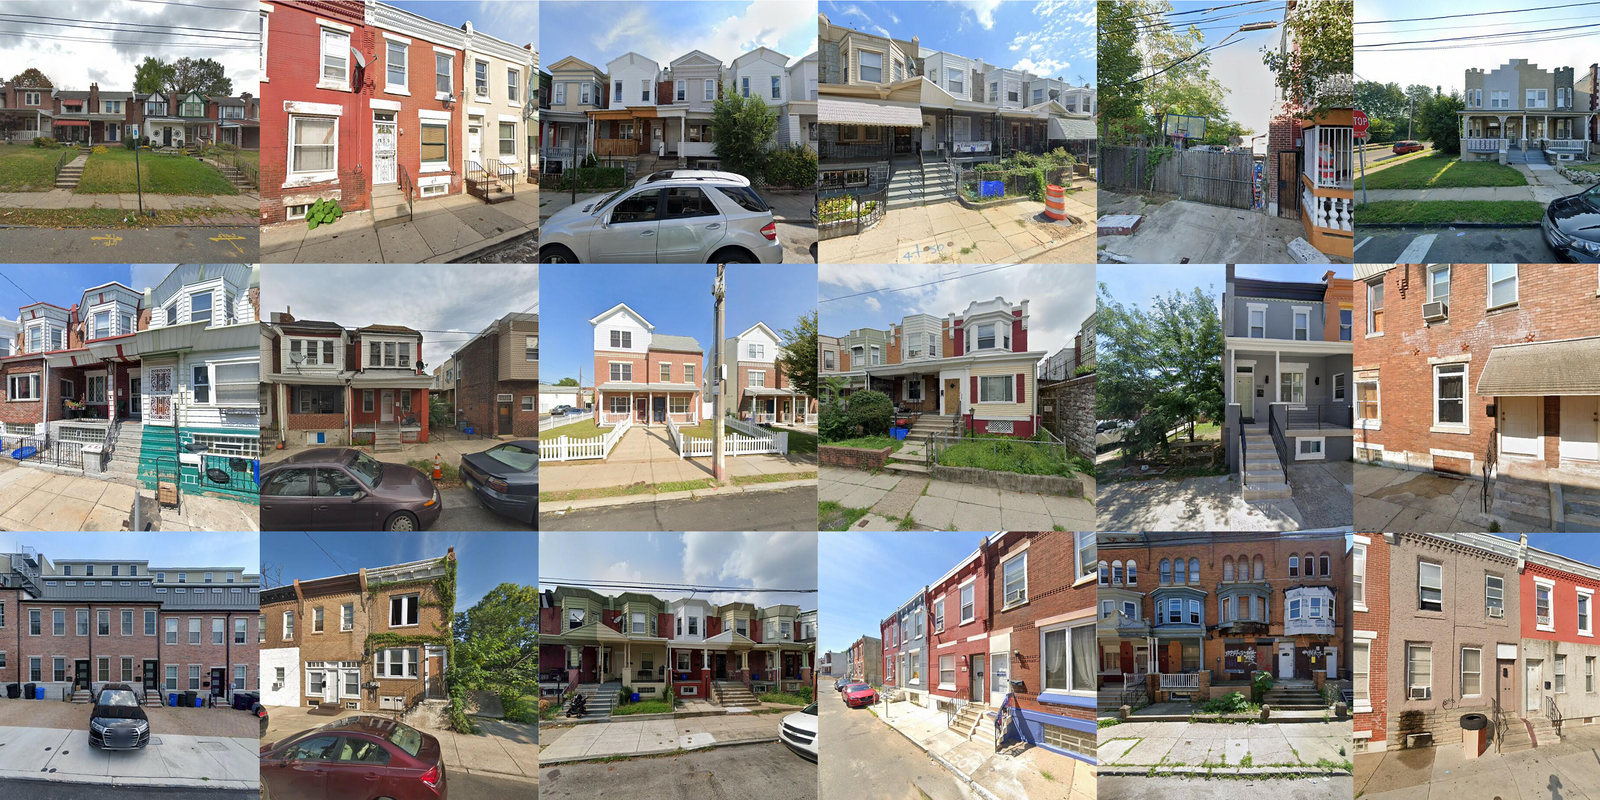
In 2022, the Federal Communications Commission (FCC) announced the Broadband Data Collection (BDC) program, a renewed effort to measure broadband availability and map the digital divide in the United States. While reports of the digital divide’s severity differ (the FCC has previously reported 14.6 million Americans as being without sufficient internet access, while others have estimated 42 million), the negative effects have long been recognized as an urgent issue, which has only deepened in the wake of the Covid-19 pandemic.1
As the Internet Society reports, “The [digital] divide is not clear cut, but no matter how you cut it, digital exclusion has many adverse impacts: lack of access to healthcare and its outcomes, decreased economic opportunities and ‘the homework gap’, a phenomenon where students are given inequal access to the educational benefits of the Internet.”2
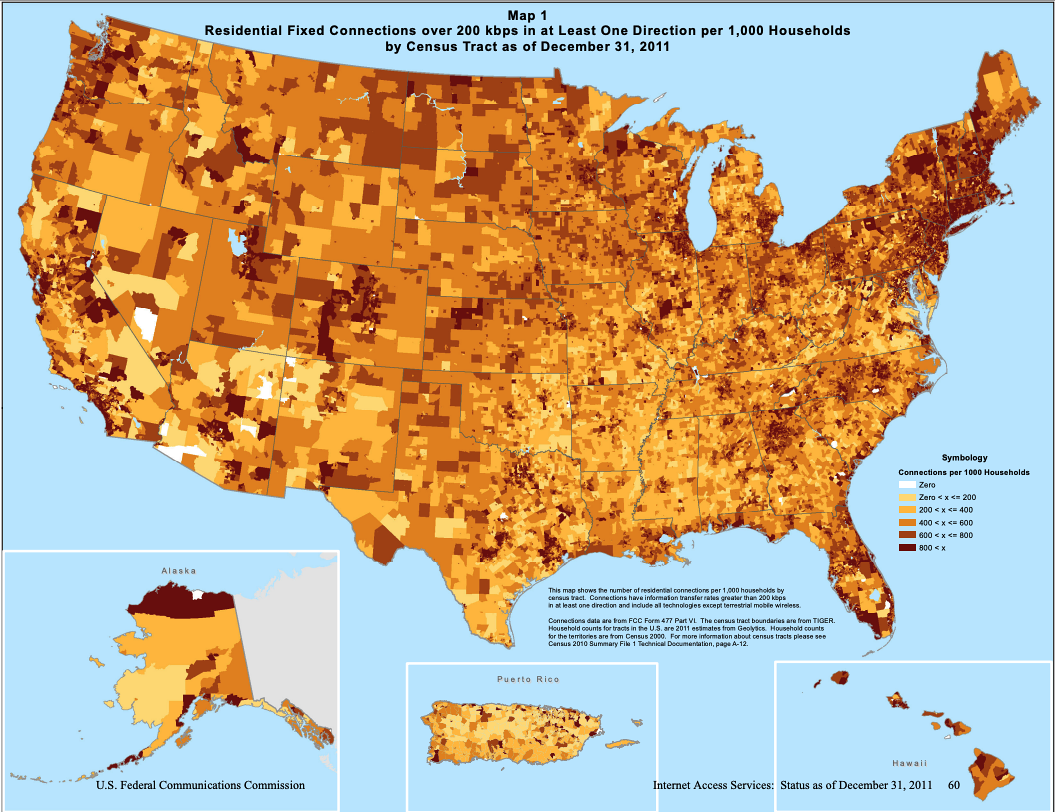
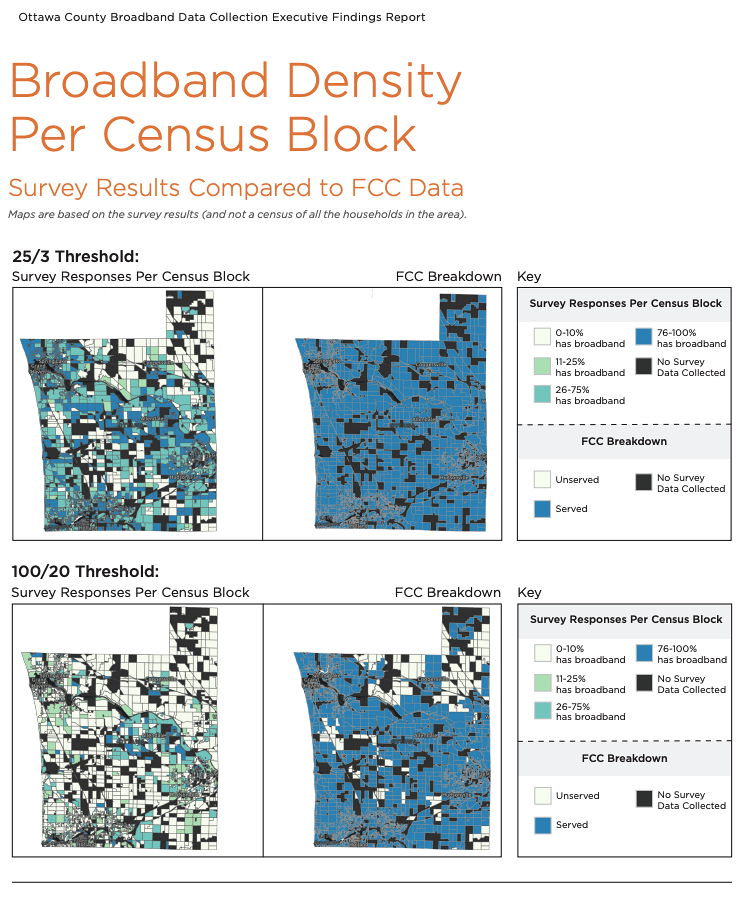
The BDC was also created in support of the Broadband Equity Access and Deployment Program (BEAD) program, a historic investment made possible by the Biden administration’s Infrastructure and Jobs Act, which allocated $65 billion dollars towards broadband infrastructure. The National Broadband Map, the BDC’s map of broadband availability in the US, was created to help the BEAD program decide how to allocate that funding to each state. These maps were also designed as an update to those created under the FCC’s 477 data program, which has often been understood as a failure due to its reliance on self-reported data from internet service providers. Through the 477 program, ISPs were not only allowed to essentially regulate themselves, but they were also able to report a census block as “served” if only one household within it was able to achieve the minimum speed of 25 Mbps download / 3 Mbps upload. Broadband availability maps using 477 data therefore diverged from the lived reality of those it represented. The BDC program attempted to right these widely-documented wrongs by requiring data to be measured on a location-by-location basis, meaning that each individual house in a census block had to be served for the block to be considered fully served. However, the data is still self-reported, and what qualifies as a “broadband serviceable location” has been heavily disputed.
Both versions of the FCC’s broadband maps are, like all maps, manifestations of a narrative. When using them, we are asked to believe that the internet is doing as well as the ISPs say it is. And though there are technically avenues for correcting the narrative they put forth, it is telling that that FCC considers the ISP’s story first and the public’s second. Instead of deciding how the internet is doing for themselves, the FCC outsources the narrative to the companies whose commercial interests incentivize a story of success.
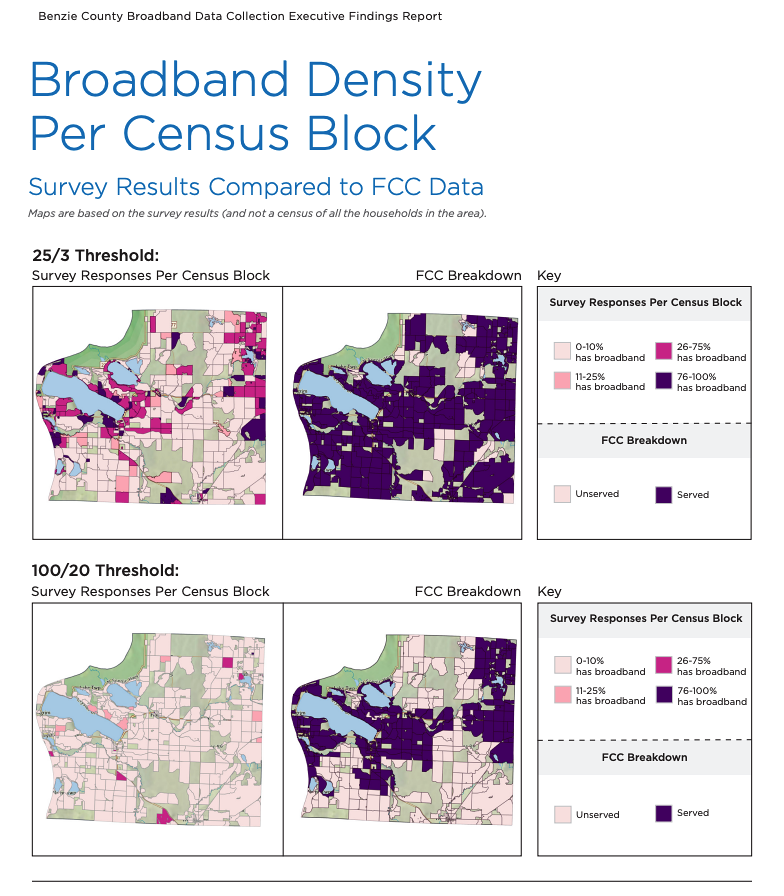
Advocates and public interest groups, such as Merit at Michigan State University and the Institute of Local Self Reliance, have historically created their own maps, using open-source and/or crowd-sourced data that refutes 477 data and, they say, better reflects the reality of individual households. The accuracy of these counter-mapping exercises is often critiqued and called into question, citing risks of “overbuilding” infrastructure where it is not needed.3
These well-established debates include nuance and rigor, but ultimately make the exercise of using these data, maps, and internet measurement methodologies a frustrating experience and almost irrelevant to what they supposedly represent, whether that is users, people, or consumers (depending on who is making the map). After all, the data is often only meant to provide a scientific method for recognizing what communities and community leaders already know to be true: those on the wrong side of the digital divide are left behind. Regardless of which metrics experts can agree upon to collect, an “accurate” map is perhaps simply the one that represents the lived experiences of its subjects.
A similar connection to lived experience is felt by those whose access to the internet is mediated through the charged politics and power dynamics in their region. In the first half of 2023 alone, Access Now’s #keepiton coalition recorded a total of eighty internet shutdowns in fourteen different countries. Loosely understood to have originated in the 2011 Syrian uprising, internet shutdowns have become the tool of choice for controlling protests and curbing freedom of expression in times of political unrest. Despite the fact that those who experience these events do not need graphs to understand them, organizations such as IODA, Censored Planet, Internet Society’s Pulse, M-Lab, Google’s Transparency Report, and Kentik provide data, analysis, and insights to document internet shutdowns in an attempt to create data-driven evidence of their occurrence. The recent conflict in Gaza is the most recent source of harrowing anecdotes describing what it is like to be without telecommunications during active attacks. While the words of the victims speak clearly and without ambiguity, internet measurement data amplifies the voices of those who experience internet shutdowns by acting as a witness that can corroborate their claims.
Some assume that a fundamental property of the internet is that it is globally connected, but countries, such as Iran and China, who have built their own “splinternets,” reject that assumption. Is the internet still the internet if it is not globally connected? Reconciling disparate answers is the current task of governance and standardization organizations such as the Internet Governance Forum, International Telecommunications Union, Internet Corporation for Assigned Names and Numbers, and Internet Engineering Task Force, all of whom have been grappling with the internet’s impact on human rights and the ways in which countries use the internet to organize themselves within the global national order. Within these efforts, internet measurement data and research operate as an artifact through which the invisible properties and dynamics of the internet can be made visible.
As the splinternet phenomenon suggests, the central challenges of today’s internet are not solely technical, but an overreliance on internet measurement data risks characterizing it as such. There is data that is capable of speaking to the experience of censorship and the digital divide, but it cannot answer why these environments occur and how they became regularized. Internet experts are quick to look for technical reasons to explain why the internet isn’t working in various ways, citing inefficiencies and misallocation of resources, but perhaps the answers are both simpler and more complex. The systemic reasons that 42 million Americans do not have access to the internet are likely related to the systemic reasons that 26 million Americans do not have healthcare, but these subtleties cannot be revealed by counting how many seconds it takes for a packet to be sent across the network. Just as it would be inconclusive to study capitalism from a purely economic perspective, or urban planning from a purely architectural lens, analysis of the internet should enrich and nourish a rigorous use of internet measurement data in other fields. Like interviewing multiple sources for a story, mapping the internet with measurements from multiple disciplines and dimensions can help supplement the gaps a technical-ruler cannot fill.


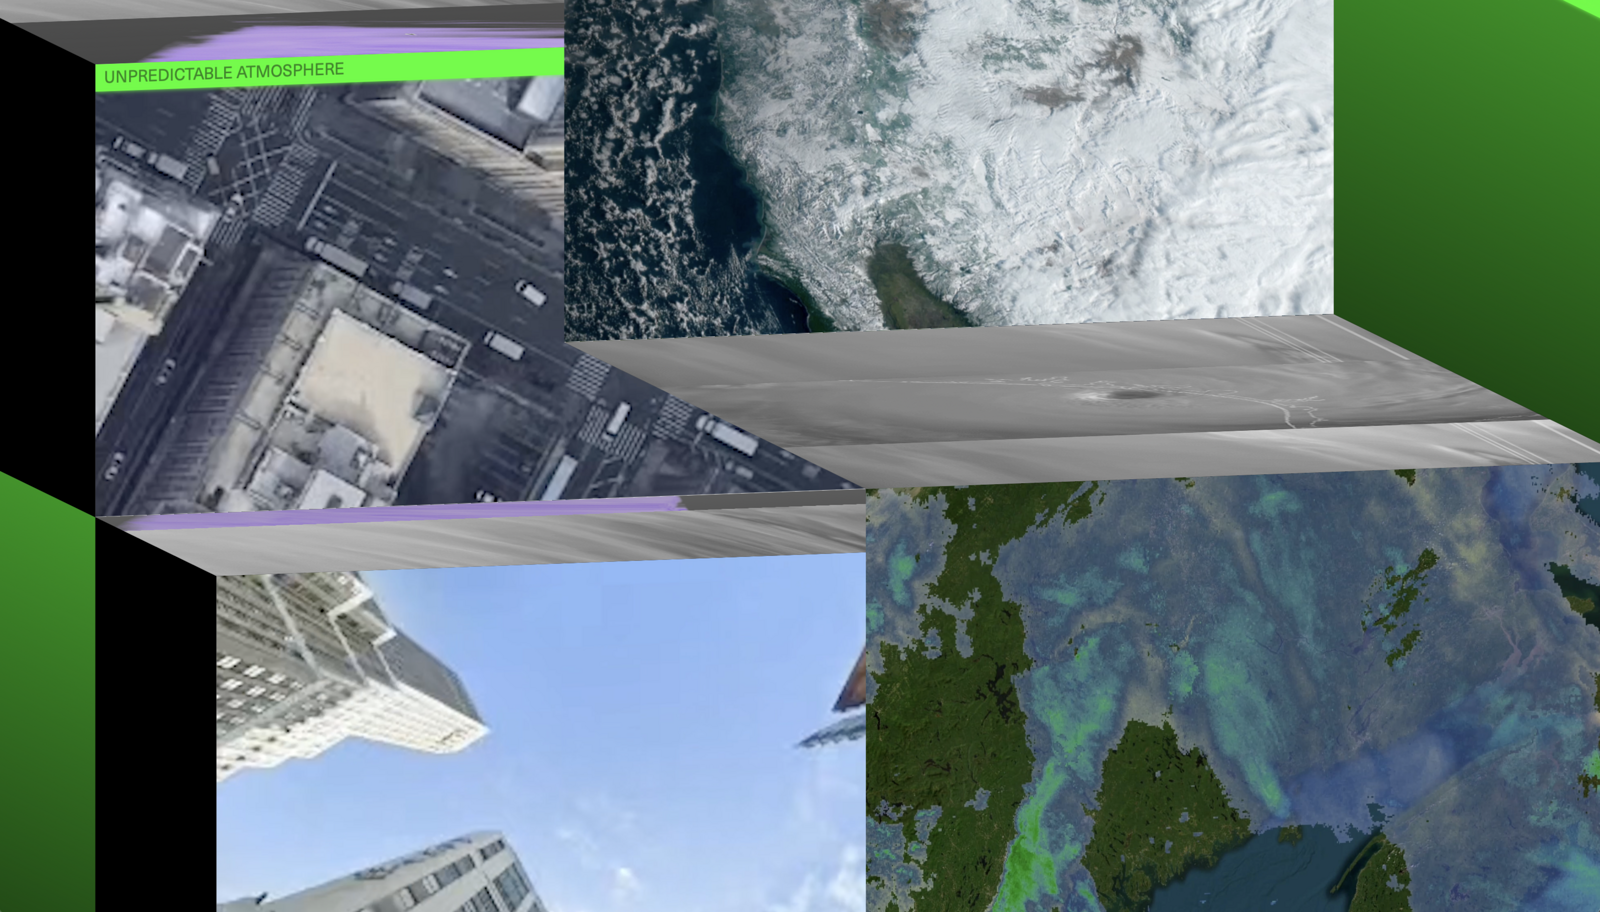
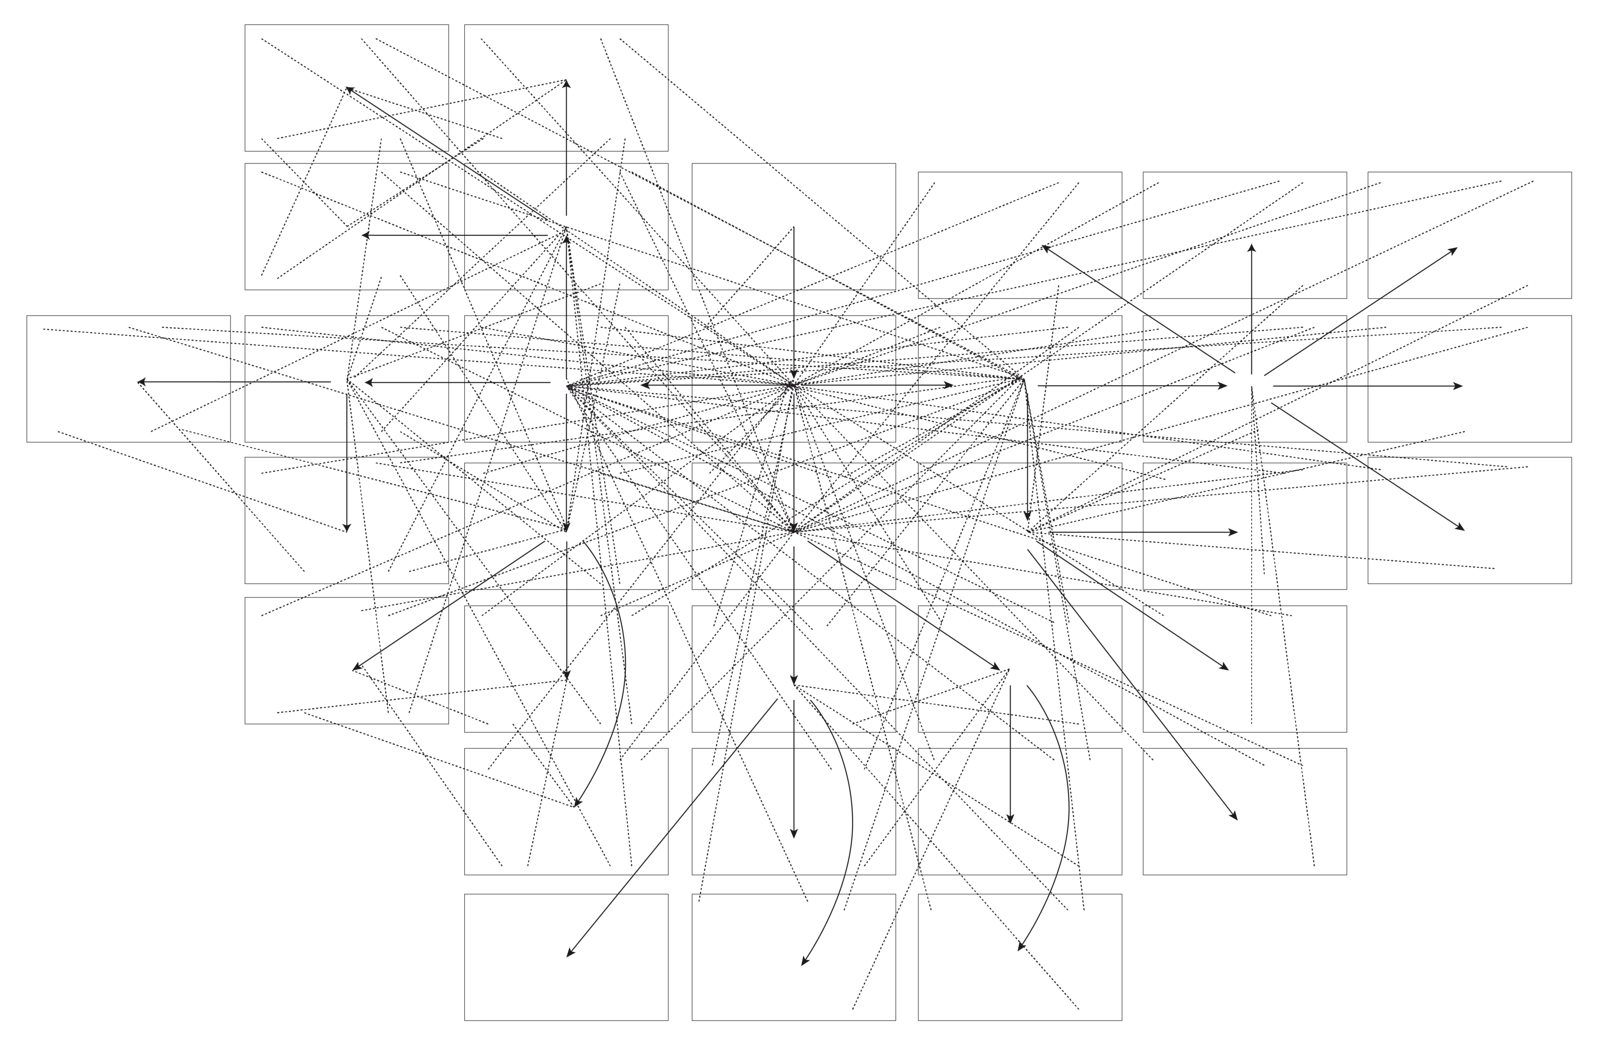
One example of what this might look like is the work of the Geopolitics of the Datasphere (GEODE) Lab at University of Paris 8, which maps both internet traffic patterns and the geopolitical dynamics through which the infrastructure and data are mediated. Mapping exercises such as these are confronted with the tricky challenge of representing the internet visually. Webbed representations of the networks that the internet is made up of (which are called Autonomous Systems) are commonly represented in an amorphous space scaled in relation to their size and traffic patterns instead of in relation to physical geography. But each of these networks is made up of physical infrastructure that exists within geopolitical borders, whose underlying dynamics of conflict and cooperation are constantly shifting. The challenge in depicting both the geographic and network characteristics of the internet speaks to its inherent dualities: physical and virtual, technical and political. The internet, like all infrastructure, is embedded within the political, social, and geographic contexts it occupies, and should be represented as such. But doing so can be difficult and requires mapping multiple layers of disparate spatial configurations.
Internet measurement data is often portrayed through a static representation, such as a map, diagram, or graph, but the internet is an active phenomenon, constantly changing and reorienting itself from minute to minute, millisecond to millisecond. As the internet changes, so does our ability to measure it consistently. Therefore, a longitudinal perspective is crucial; any static representation is only relevant for the snapshot in time it presents. Fixed images of the internet are more accessible and are perhaps suitable for certain use cases, but a more nuanced perspective is a dynamic one that depicts how the internet has changed over time. For example, in the case of documenting internet shutdowns, incorporating timelines is crucial in identifying a network’s decrease in connectivity as an interference event against the network’s usual behavior. That said, such a perspective is often difficult to execute. As the 2021 report by the Workshop on Overcoming Measurement Barriers to Internet Research points out, the internet was not built to be measured with scientific precision.4 Thus, researchers often resort to ad hoc methods for approximating what various metrics imply, or the reverse: what behaviors can be represented by the various metrics available. These scaffolded methods can break at any time (and they do), thereby producing a change in the data that is due to the tool rather than the subject that the tool is measuring. Additionally, the availability of vantage points can be volatile due to the demands of equipment maintenance, changes in the physical infrastructure, or, in the case of active measurements, shifts in user testing behavior. The funding ecosystem for developing and maintaining the infrastructure necessary to keep measurement infrastructure available is also fragile, often depending on the whims of corporate responsibility, the remits and red tape of government regulation, and fickle academic funding cycles.


Approximate ratio of IP address space Measurement Lab (M-Lab) has collected while conducting internet measurements from each year since 2009. Source: M-Lab.
These challenges notwithstanding, measuring the internet over time is the only way its impact and behavior can be understood in totality. What does it mean for the internet to be working the way we want it to? And who is we? Try as we might to answer these questions in real-time, we might only be able to fully consider them within the longer arc of history—history of both the internet itself and of the systems that create and maintain it. Internet researchers often focus on the nuances of measurement on a micro scale, and for good reason: the implementation details fundamentally shape the resulting narrative. But if we can also consider the act of measuring the internet as an archival practice, one less focused on present performance and more concerned with the overall arc of the internet’s history and future trajectory, the details of how we measure become second to ensuring that we can do it all. As in measuring a child in a doorway against a hand-drawn yardstick, the ruler can be whatever you want, so long as it’s consistent. In fact, when I tell people I measure the internet for a living, they sheepishly ask, “Well… how tall is it?” As much of a dad joke as that might be, it gets at how simple the premise of internet measurement really is: measure the internet every day and watch its height change over the time. How tall is the internet? We don’t know, but we can learn more by asking.
John Busby, Julia Tanberk, and Tyler Cooper, “BroadbandNow Estimates Availability for all 50 States; Confirms that More than 42 Million Americans Do Not Have Access to Broadband,” BroadbandNow, November 8, 2023. See ➝.
Charlie Muller and João Paulo de Vasconcelos Aguiar, “What is the Digital Divide?,” Internet Society (blog), March 3, 2022. See ➝.
kc claffy, David Clark, Fabián E. Bustamante, John Heidemann, Mattijs Jonker, Aaron Schulman, and Ellen Zegura, “Workshop on Overcoming Measurement Barriers to Internet Research (WOMBIR 2021) Final Report,” ACM SIGCOMM Computer Communication Review 51, no. 3 (July 2021). See ➝.
Spatial Computing is a collaboration with the M.S. in Computational Design Practices Program (MSCDP) at the Graduate School of Architecture, Planning, and Preservation (GSAPP) at Columbia University.